
Machine learning (ML) adoption is growing at 43% year-over-year with an estimated $30B of spend by 2024 as companies transition their ML use cases from pilot projects to production. Financial services is one example of an industry poised to extract almost $300B of value from AI with key use cases across underwriting, fraud, and anti-money laundering. Often, these ML teams need to predict outcomes that have a high imbalance in class occurrences, known as “class imbalance”.
Model training data must include the ground truth for expected classes. In use cases with class imbalance, the frequency of occurrence of one or more of these classes (the minority class) is substantially less than the others (the majority class). Consider, for example, an ML model that is trying to predict a fraudulent transaction. There are typically only a handful of fraudulent transactions among many hundred transactions. This corresponds to very few cases of fraud (positive examples) among a sea of non-fraudulent cases (negative examples).
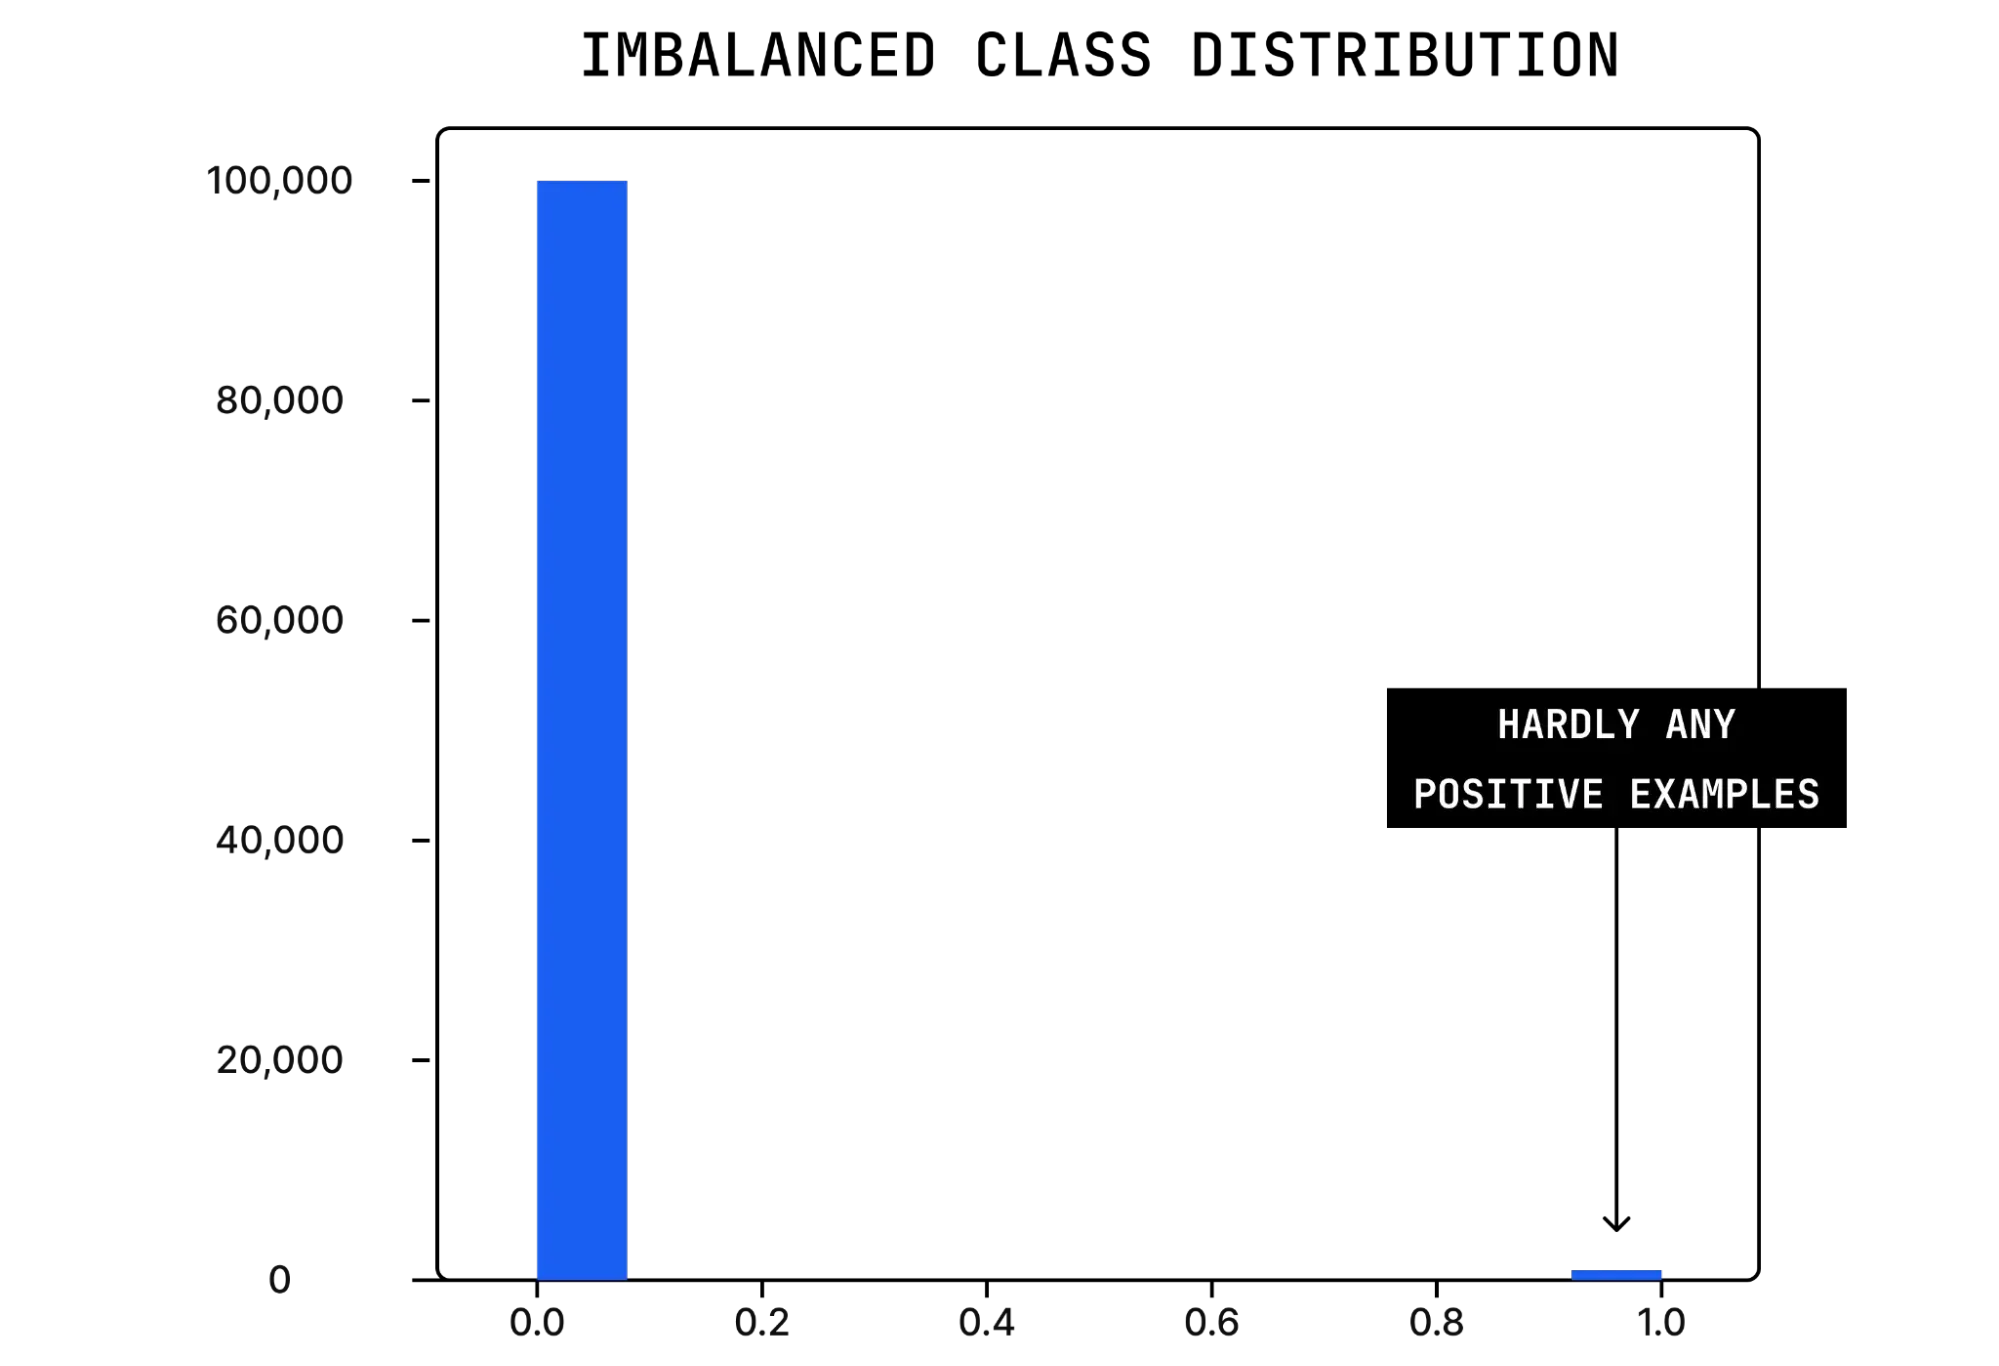
Histogram illustrating predictions between 0 and 1 for the probability of fraud, with 0.0 being no fraud and 1.0 being fraud
Impact of class imbalance
Due to its lower frequency, changes in the minority class can have an outsized impact — e.g. a small shift in the amount of fraud can have major business outcomes. This makes it absolutely imperative to continuously monitor data drift in the minority class occurrence.
In the absence of real time labels, ML teams use model drift metrics like Jensen-shannon Divergence (JSD) and Population Stability Index (PSI) as leading indicators for performance issues. But for scenarios with heavy class imbalance, the minority class’ contribution would be minimal. Hence, any change in production distribution with respect to the minority class would not lead to significant change in overall model metrics. Consequently, the drift value also would not change much.
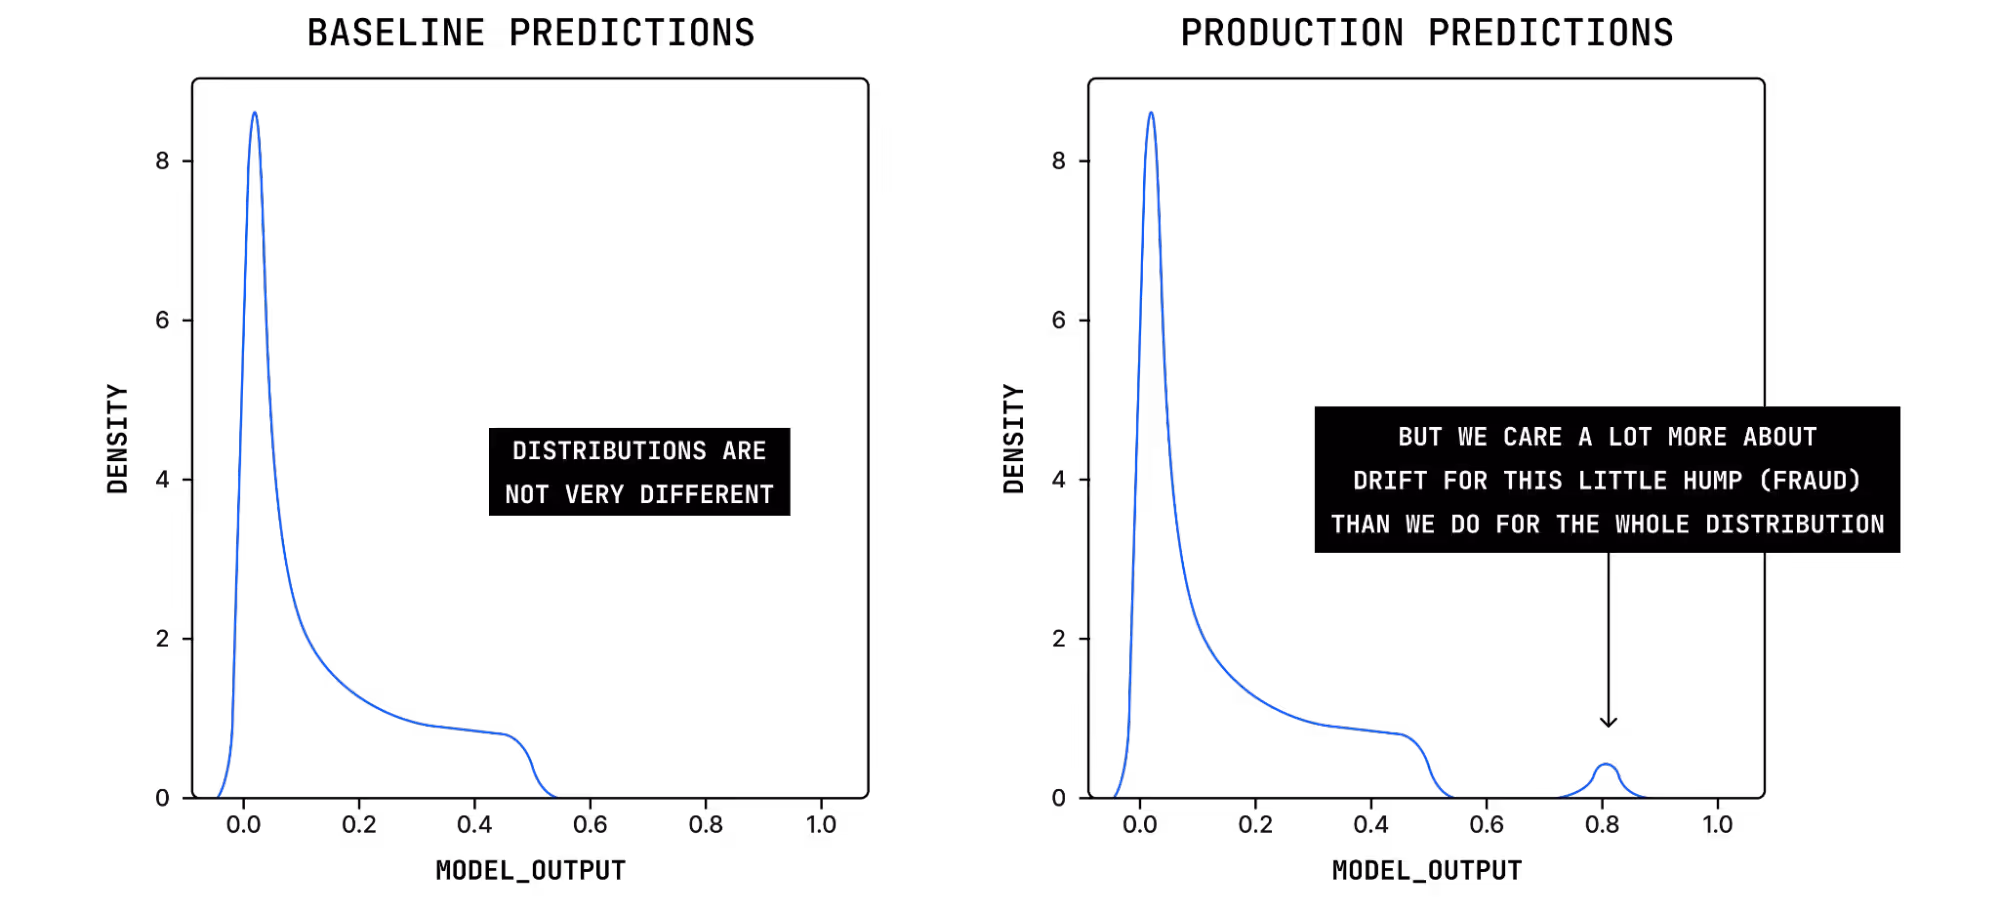
Consider the case where we have an unexpected surge of fraudulent behavior in production. In the following diagram we can see that the number of high-probability predictions has increased substantially when compared to predictions made on the baseline data. This is a critical issue that we would like to know about as soon as possible. Standard JSD on this distribution would not pick up this substantial change in fraudulent activity because the drift calculation looks at the prediction distribution as a whole. Despite little change to the overall distribution because of the imbalanced datasets, there is actually a dramatic change to a part that’s business critical.
Addressing class imbalance for model monitoring
So how can MLOps teams solve for class imbalance and monitor nuanced and rare model drift that could have devastating business impact? There are three key approaches to addressing the problem in model monitoring:
- Segment based on prediction score
- Segment on ground truth
- Weighting model predictions
Read our whitepaper on class imbalance to find out which method is right for your business, ML team, and model behavior.